

Q&A with Portfolio Manager Movin Mokbel
Movin Mokbel, Fixed Income Portfolio Manager and expert on leveraged loans, offers his thoughts on the current loan market. With 21 years of experience in fixed income markets and deal originations, Movin is the Lead Portfolio Manager for Mackenzie Floating Rate Income Fund and ETF. Here he discusses how he is positioning the portfolio in the late stages of the COVID-19 pandemic.
The Mackenzie Fixed Income Team has been investing in the floating rate loan space since 2013 and, as a testament to the liquidity of this segment, we launched Mackenzie Floating Rate Income ETF (MFT) in April 2016.
Following a healthy recovery from the pandemic-induced sell-off in spring 2020, the loan market has maintained positive momentum through the first four months of 2021. This has encouraged sustained inflows after an extended period of outflows.
Q1. As an asset class, how have loans behaved during the COVID induced market correction in March 2020 and since then?
A: The pandemic came as a global shock. It triggered an increase in volatility as investors sold risk assets in favour of government-backed safe havens. In March 2020, the loans index1 returned -12.5%, with spreads widening to more than 1,000 basis points on market outflows during that period. But relatively speaking, that was lower than 1,600 bps witnessed in the 2008 Great Financial Crisis (GFC).
Chart 1 - Average secondary spread to maturity
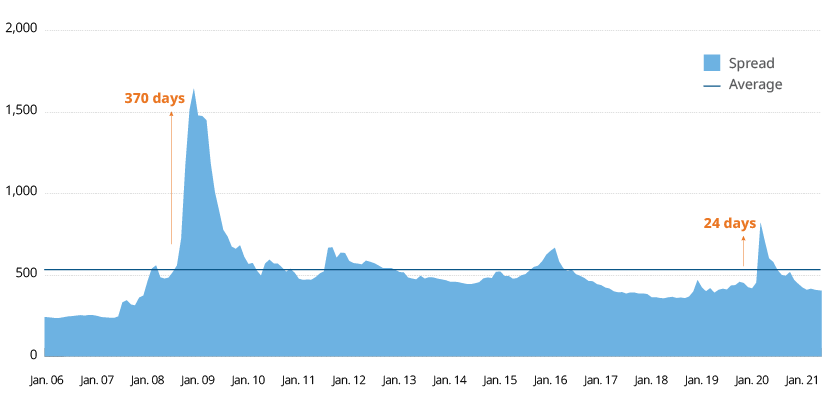 Source: LCD, an offering of S&P Global Market Intelligence, S&P/LSTA Leveraged Loan Index
Roughly US$19 billion left the asset class in 2020, in addition to the US$28 billion in outflows in 2019.2 Our fund was no exception to this sentiment, but we had adequate liquidity to meet the rush of redemptions.
In the second quarter, however, the high-yield market gained traction, in part because investors recognized there were many “fallen angels” in the space which had been oversold, and also due to the Federal Reserve extending its bond buying program to include high yield bonds. As a result, the high yield benchmark now has a 54% exposure to BB-rated bonds3 and that’s facing a new headwind: the potential for rising rates. Of course, loans are not affected by this concern due to their floating-rate nature.
As markets normalized, the loan asset class displayed their benefits of diversification and low correlation and have posted a 12-month return of 20.7%, as of March 2021.
In terms of issuance, we saw a record of US$181 billion in Q1 2021, with refinancing contributing US$80 billion of that total – and this involved a surge of loan repayments.
As a result, the loan market grew to a record US$1.2 trillion in assets the end of March 2021, compared to US$1.5 trillion for the high-yield market.4
Q2. How was the 2020 experience different from that of the Great Financial Crisis?
We saw much more volatility in 2020 than in 2008-09 crisis, but that included some positive volatility. In the Financial Crisis we saw spreads above 600 bps for sixteen months. In 2020, spreads were that high for just three months.
Twelve years ago, the loans market was only about US$500 billion, compared to the US$1.2 trillion it hit in March 2021.
Default rates were much higher in the 12 months from March 2009 to February 2010, averaging 9% per month. This time around it peaked at 4.2% in September 2020, largely due to the more favourable monetary and fiscal policies used to address the pandemic.
Chart 2 - Default Rates -below historical average and down 244 bps from the Sep. ’20 cycle peak
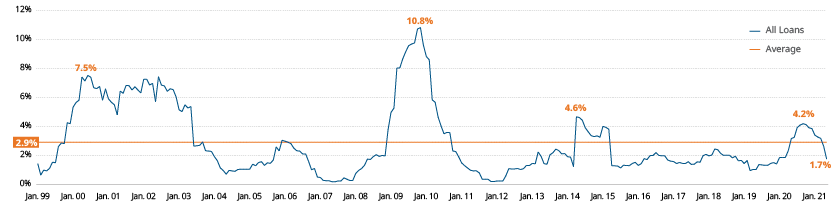 Source: LCD, an offering of S&P Global Market Intelligence, S&P/LSTA Leveraged Loan Index
We avoided most of the bankruptcies in 2018 and did so again in 2020. We did have about 5-6% exposure to the energy and travel sectors in Q1 2020 – the two most COVID-vulnerable sectors – and that is now about 4-5%.
Q3. How would you describe your management style and key differentiations?
In our investment philosophy, fundamental credit analysis underpins every investment followed by analysis of covenants and deal structure. Our strategy steers us clear of distressed credits which can often be bought at a discount. We focus on quality credits, and it shows in the weighted average price: $98.24 (per $100 face value) in the fund and $98.83 in the ETF, versus $97.55 as the market average as of March 2021.
Our management style is very active. We participate in primary market issuance as much as possible to try to capture the original issue discount and we are selectively opportunistic on secondary markets.
We have always tended to focus on new issues that are under-the-radar and off-benchmark, that we believe have attractive valuations and tight structures. These make up more than 70% of the portfolio. We prefer senior secured first lien loans, while we underweight second lien loans and don’t buy as many B-rated loans.
The loans we invest in come with some level of price discovery, are generally smaller in size, have less leverage, higher asset coverage and are usually better structured than the benchmark deals. They also pay a higher coupon and we generally hold them to maturity.
Often these borrowers are not seasoned issuers and the market is not as familiar with them, or they are “storied” credits where the market requires favourable concessions on structures and higher coupons. We have found these deals tend to do well in the secondary market and over the cycle.
Q4. How is the mandate positioned as of May 2021?
The mandate is a near pure play in loans, with a small amount – currently about 5-6% – in high yield bonds. We hold these bonds for their higher potential for price appreciation compared to loans. Traditionally Mackenzie has settled loans faster than the industry with almost 75% of loans executed in less than 10 days, compared to industry turnover of 50%.
I would say the portfolio is defensive at the moment. From March 2020 to December 2020, our exposure to CCCs was higher, averaging about 10% compared to the benchmark weight of 7.65%. We are now around 4% to 5% and are also underweight second lien loans. At the same time, the portfolio’s yield to maturity is around 60 bps higher than the index, compared to 120 bps in December 2020.
The fund is 90% exposed to the US, which is not surprising given the size of the market, and we have 8% exposure to Canada and 1% to Europe. Foreign currency exposure is predominantly hedged back to CAD. At a granular level, the portfolio provides exposure across 30 sectors, spread across 200 borrowers. The average position is not more than 1.7% per borrower.
Q5. How do you manage default scenarios?
Our preference for first lien loans, at the top of the capital structure, helps us stay nimble and avoid concentration risks.
Every situation is different, we watch for early signs by having constant communication with the analysts and reviewing the company releases and news flow. We reflect on what the loan is trading at compared to our recovery estimates to arrive at an informed credit decision. If we are convinced of a recovery higher than the market price, then we hold. Otherwise we try to sell before they default if we can find a buyer. If not, we try to capture most of the recovery.
In certain cases when a company defaults, we see debtor-in-position financing, where the lender becomes the owner, and this allows the business to continue operating.
Q6. What’s your view on covenant-lite loans and where do you stand today?
Covenant-lite loans have less restrictive covenants, rather than the traditional maintenance covenants. But this doesn’t mean that a borrower’s underlying credit is weak, nor do strong covenants make a weak credit better.
We believe that the loss of maintenance covenants is moot if the underlying credit is healthy, and the business model supports the issuer's ability to manage debt.
Covenant-lite loans have grown to almost 85% of the index compared to 20% just 10 years ago.5 This reflects an increased presence in the space by seasoned high-quality issuers with higher market acceptance. Covenant-lite loans make up nearly 80% of both our fund and ETF as of Mar’21, which is in line with our focus on non-benchmark deals.
Q7. Do Loans need rising rates to perform?
Contrary to what may be popular belief, loans do not need a rising rates environment to perform well. The asset class has historically delivered across rate cycles.
Chart 3 – Periods of falling Treasury yields, followed by above average returns
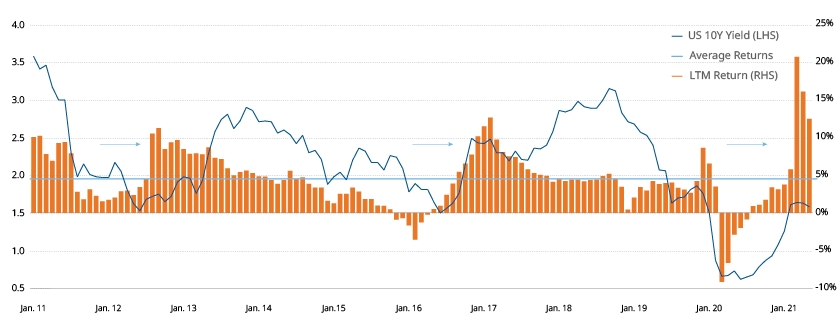 Source: LCD, an offering of S&P Global Market Intelligence, S&P/LSTA Leveraged Loan Index and Bloomberg for US 10Y Treasury Yields
For a core-plus fixed income sleeve, there is a strong case for a strategic allocation to loans as part of the “plus” component, which consists of higher yielding fixed income assets.
Bear in mind that these are secured loans at the top of the capital structure, so they offer more protection than unsecured bonds, convertible bonds, preferred shares and equity.
The risk of default or bankruptcy reinforces how vital active management is in this space. It allows us to create value by avoiding risky names, manage lower defaults and potentially provide a favourable risk-adjusted reward.
The Mackenzie loans team is a seasoned participant in the loan space and have demonstrated our capability consistently since 2013.
Q8. What are your views on the transition from the London Interbank rate (LIBOR) to secured overnight financing rate (SOFR)?
In our view the transition is much like the “Y2K” event: by the time it happens it will be a non-event, because all stakeholders are well aware of the proposed change. The Intercontinental Exchange (ICE) will continue publishing LIBOR through June 20, 2023, by which time a considerable number of US-dollar loans tied to LIBOR will have matured.
However, the extension does not alter the regulatory perspective on new loan issuances: that market participants should already be using language that provides for an automatic switch from LIBOR to a replacement in new loan agreements and that June 30, 2021 should be the target for the cessation of new loans based on LIBOR.
Q9. What are the key risks and investment opportunities in the loan market?
We expect to see higher levels of volatility that we hope to be able to capitalize on in our mandates. Volatility could arise from any one of a number of uncertainties that continue to loom over capital markets as a whole and not loans in particular: vaccine efficacy for variants, pace of economic recovery, size of fiscal stimulus and infrastructure packages, and the potential for government bond yields to continue higher.
There’s also the risk of significant spread repricing with rally in price above par, which could have a potential impact to the return expectations, similar to what we saw in the first quarter, when almost 20% of loans were repriced/repaid.
We could also see an increase in bad deals as market sentiment turns bullish. In this context we often see bad deals where companies increase their leverage, and that can have a negative impact on their credit quality.
Credit selection will only become more important through the rest of 2021, as investors shift from buying market beta to an increased focus on corporate earnings and fundamentals, considering the record low spreads and certain cyclical sectors.
We expect demand for quality loans to outpace supply for several reasons, ranging from positive flows from retail funds and rising allocations among institutional investors, to demand from new US collateralized loan obligation (CLO) formation and purchasing by hedge funds.
But despite the risk to economic drivers, the economy is functioning. The stronger growth outlook and steepening yield curves provide a strong relative value in the current rate environment. Recovery for loans has lagged, so there is further room to rally compared to other asset classes, as leverage and coverage ratios improve.
1 LCD, an offering of S&P Global Market Intelligence, S&P/LSTA Leveraged Loan Index
2 Lipper; JP Morgan
3 LCD, an offering of S&P Global Market Intelligence, S&P/LSTA Leveraged Loan Index
4 LCD, an offering of S&P Global Market Intelligence, S&P/LSTA Leveraged Loan Index
5 LCD, an offering of S&P Global Market Intelligence, S&P/LSTA Leveraged Loan Index
As of June 30, 2021
Mackenzie Floating Rate Income Fund - F 1.30%(3M) 3.20%(YTD) 10.70% (1Y) 2.10% (3Y) 4.80%(5Y) 4.20%( SI)9-May-13 (Inception Date)
Mackenzie Floating Rate Income ETF 1.50%(3M) 3.30%(YTD) 10.20%(1Y) 2.40%(3Y) 4.90%(5Y) 4.90%(SI) 19-Apr-16(Inception Date)
S&P/LSTA Leveraged Loan Index (Hedged to CAD) 1.50%(3M) 3.20%(YTD) 11.40%(1Y) 3.50%(3Y) 4.20%(5Y) 4.80(SI)
Commissions, trailing commissions, management fees, and expenses all may be associated with mutual fund investments. Please read the prospectus before investing. Mutual fund securities are not covered by the Canada Deposit Insurance Corporation or by any other government deposit insurer. There can be no assurances that the fund will be able to maintain its net asset value per security at a constant amount or that the full amount of your investment in the fund will be returned to you. Past performance may not be repeated.
This document may contain forward-looking information which reflect our or third party current expectations or forecasts of future events. Forward-looking information is inherently subject to, among other things, risks, uncertainties and assumptions that could cause actual results to differ materially from those expressed herein. These risks, uncertainties and assumptions include, without limitation, general economic, political and market factors, interest and foreign exchange rates, the volatility of equity and capital markets, business competition, technological change, changes in government regulations, changes in tax laws, unexpected judicial or regulatory proceedings and catastrophic events. Please consider these and other factors carefully and not place undue reliance on forward-looking information. The forward-looking information contained herein is current only as of May 31, 2021. There should be no expectation that such information will in all circumstances be updated, supplemented or revised whether as a result of new information, changing circumstances, future events or otherwise.
The content of this [type of marketing communication] (including facts, views, opinions, recommendations, descriptions of or references to, products or securities) is not to be used or construed as investment advice, as an offer to sell or the solicitation of an offer to buy, or an endorsement, recommendation or sponsorship of any entity or security cited. Although we endeavour to ensure its accuracy and completeness, we assume no responsibility for any reliance upon it.